

Bitcoin is consolidating above the $39,250 support zone against the US Dollar. BTC could recover if it manages to clear the $40,250 resistance zone.
- Bitcoin retested the $39,250 support zone and found a strong buying interest.
- The price is still trading below $41,000 and the 100 hourly simple moving average.
- There is a connecting bearish trend line forming with resistance near $40,250 on the hourly chart of the BTC/USD pair (data feed from Kraken).
- The pair could start a short-term recovery if there is a move above $40,250.
Bitcoin Price Remains Supported
Bitcoin price attempted an upside correction above the $40,000 level. BTC climbed above the $40,400 level, but the bears remained active.
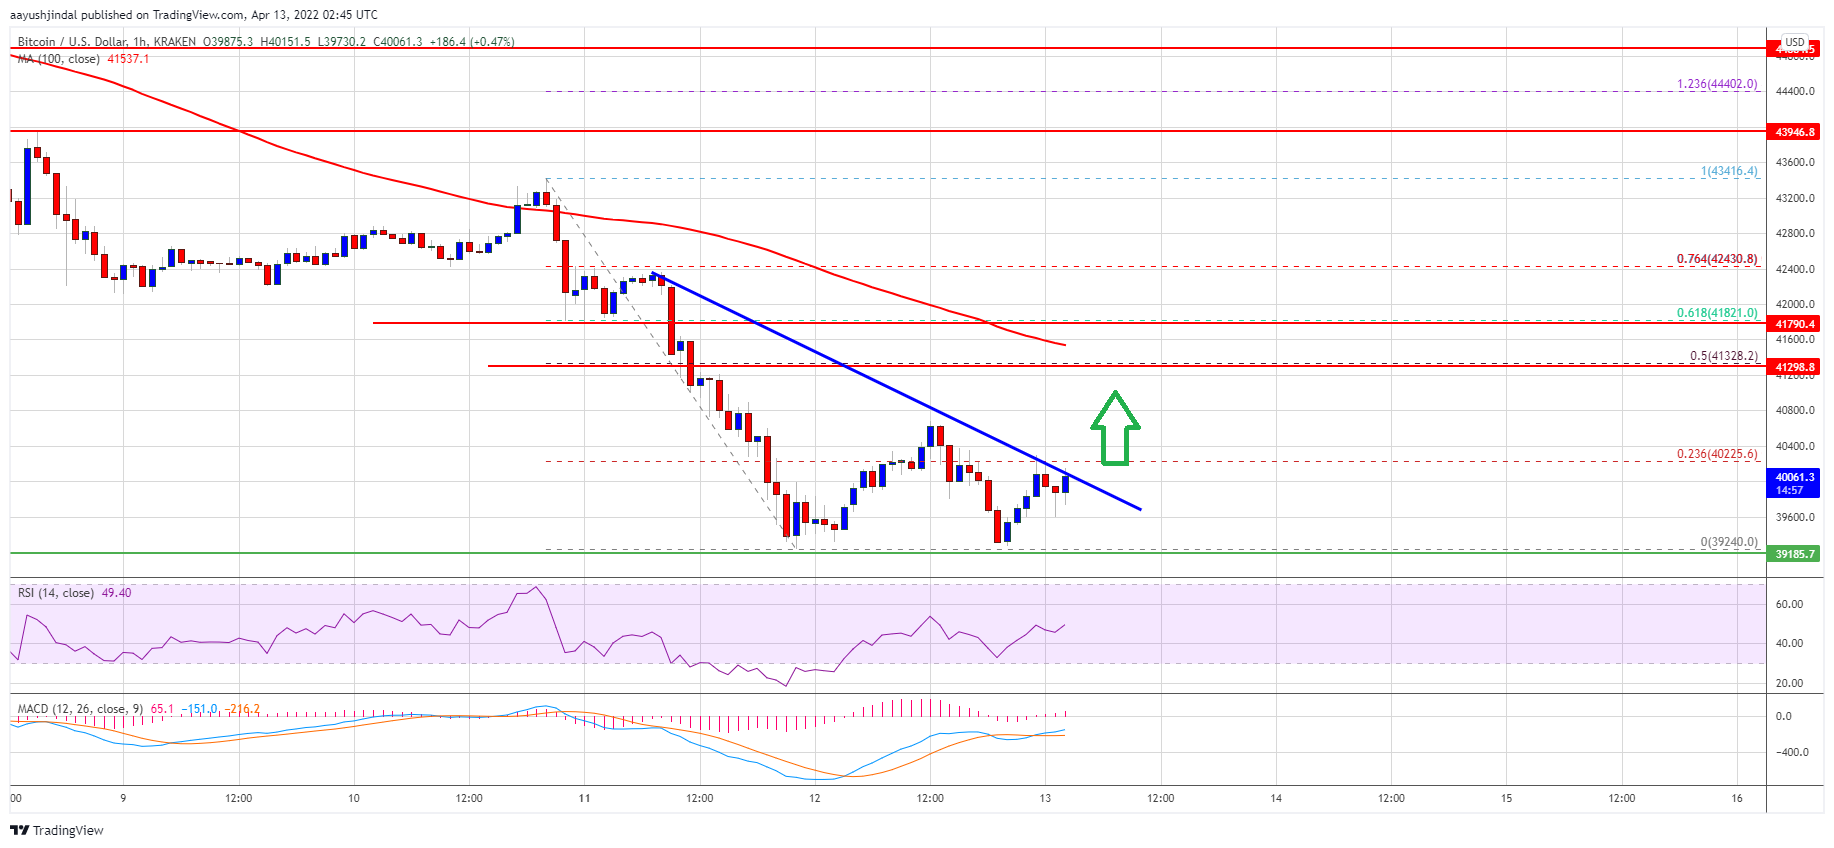
It seems like the price struggled to stay above the 23.6% Fib retracement level of the key decline from the $43,416 swing high from the $39,240 low. A high was formed near $40,800 and the price started another decline. There was a break below the $40,000 level, but the bulls again defended the $39,250 zone.
It is now consolidating near the $40,000 level, but it is well below the 100 hourly simple moving average. An immediate resistance on the upside is near the $40,250 level. There is also a connecting bearish trend line forming with resistance near $40,250 on the hourly chart of the BTC/USD pair.
A clear move above the trend line could send the price towards $40,800. The next resistance could be near $41,250. It is close to the 50% Fib retracement level of the key decline from the $43,416 swing high from the $39,240 low.
Source: BTCUSD on TradingView.com
If the bulls able to clear the $41,250 and $41,350 resistance levels, the price could accelerate higher. In the stated case, the price may perhaps rise towards the $41,800 resistance zone or the 100 hourly simple moving average.
Another Decline in BTC?
If bitcoin fails to clear the $40,250 resistance zone, it could continue to move down. An immediate support on the downside is near the $39,600 level.
The next major support is seen near the $39,250 level. A downside break below the $39,250 support zone could accelerate losses. In the stated case, the price could decline towards the $38,500 level or even $38,000.
Technical indicators:
Hourly MACD – The MACD is slowly gaining pace in the bullish zone.
Hourly RSI (Relative Strength Index) – The RSI for BTC/USD is now just above the 50 level.
Major Support Levels – $39,600, followed by $39,250.
Major Resistance Levels – $40,250, $41,250 and $41,800.